If you haven't checked out our video and blog on Root Cause Analysis, make sure you take a moment to click those links and catch up.
Using Pareto Charts
A Pareto Chart is a powerful tool to identify and address the largest root causes of a problem. This is vital information to make sure that your improvement efforts have the biggest impact!
The Pareto Principle is named after Italian sociologist and economist Vilfredo Pareto who created the Pareto Principle: about 20% of the causes will create 80% of the impact.
The Pareto Principle will help your team single out the vital few biggest causes of a problem!
Let’s look at a simple example:
A restaurant improvement team aims to improve service and decides to conduct a root cause analysis. They start by analyzing principal customer complaints from online reviews.
Step 1.
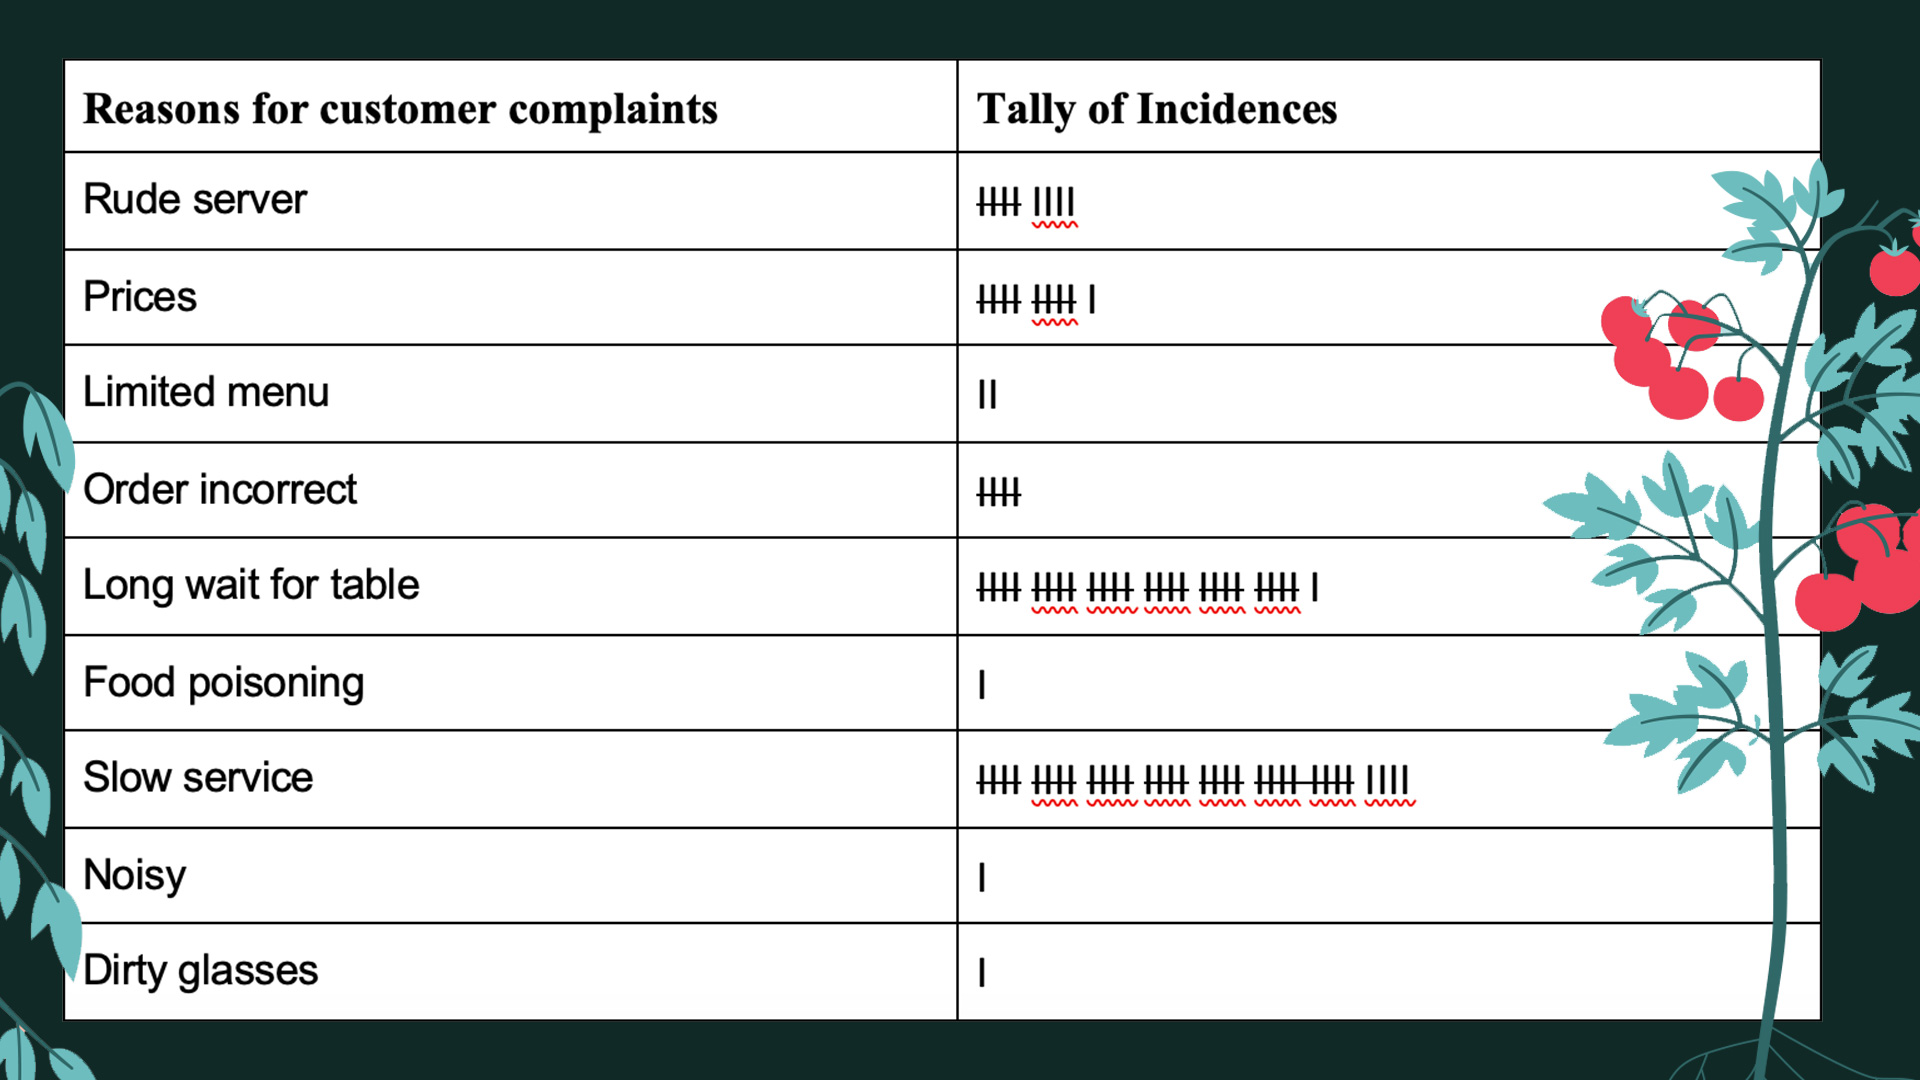
- Brainstorm general categories of causes – in this case: reasons for customer complaints.
- Review the data and tally the number of incidences for each category (cause).
- The more data you have, the better the information will be about the root causes of the issue you want to improve.
Step 2.
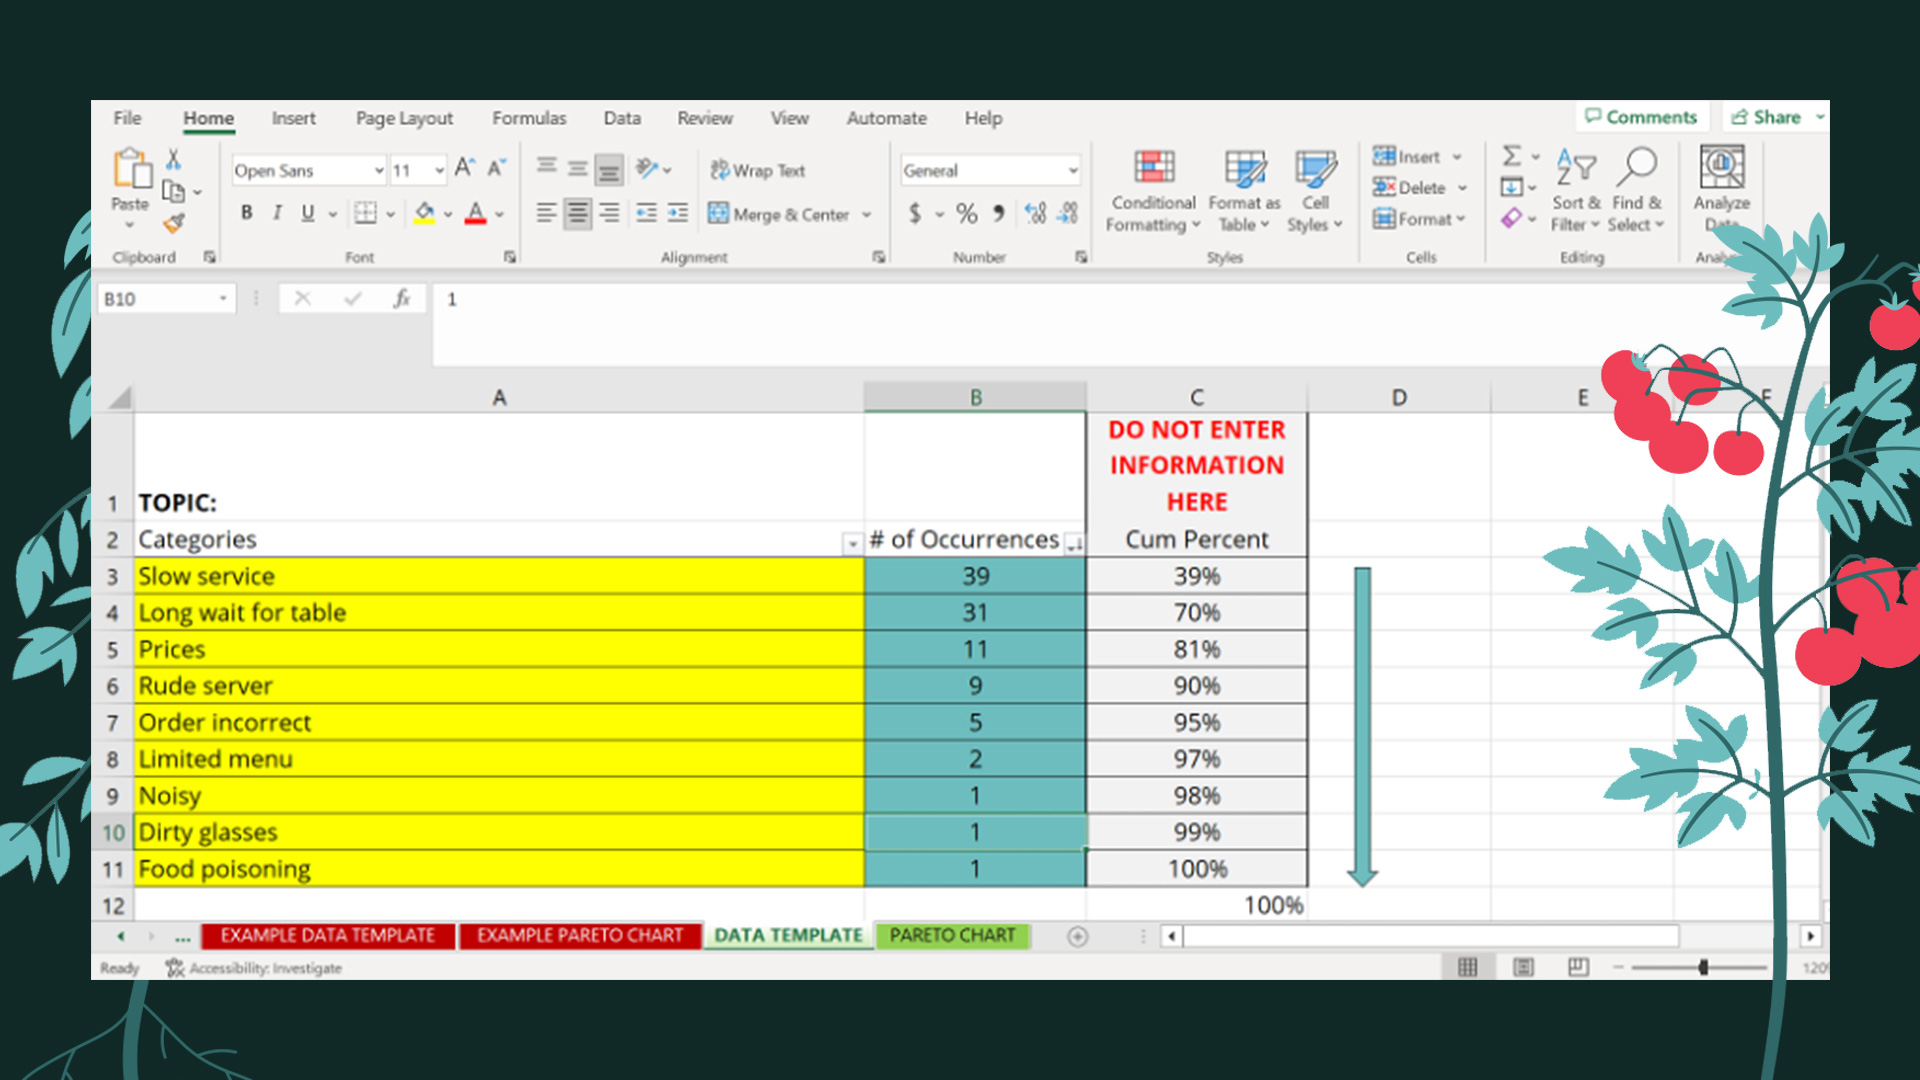
Open Shift’s Pareto Chart template.
- Click the link and download the template
- Click on the “data template” tab.
- Put the causes in order of frequency – from most to least frequent.
Step 3.
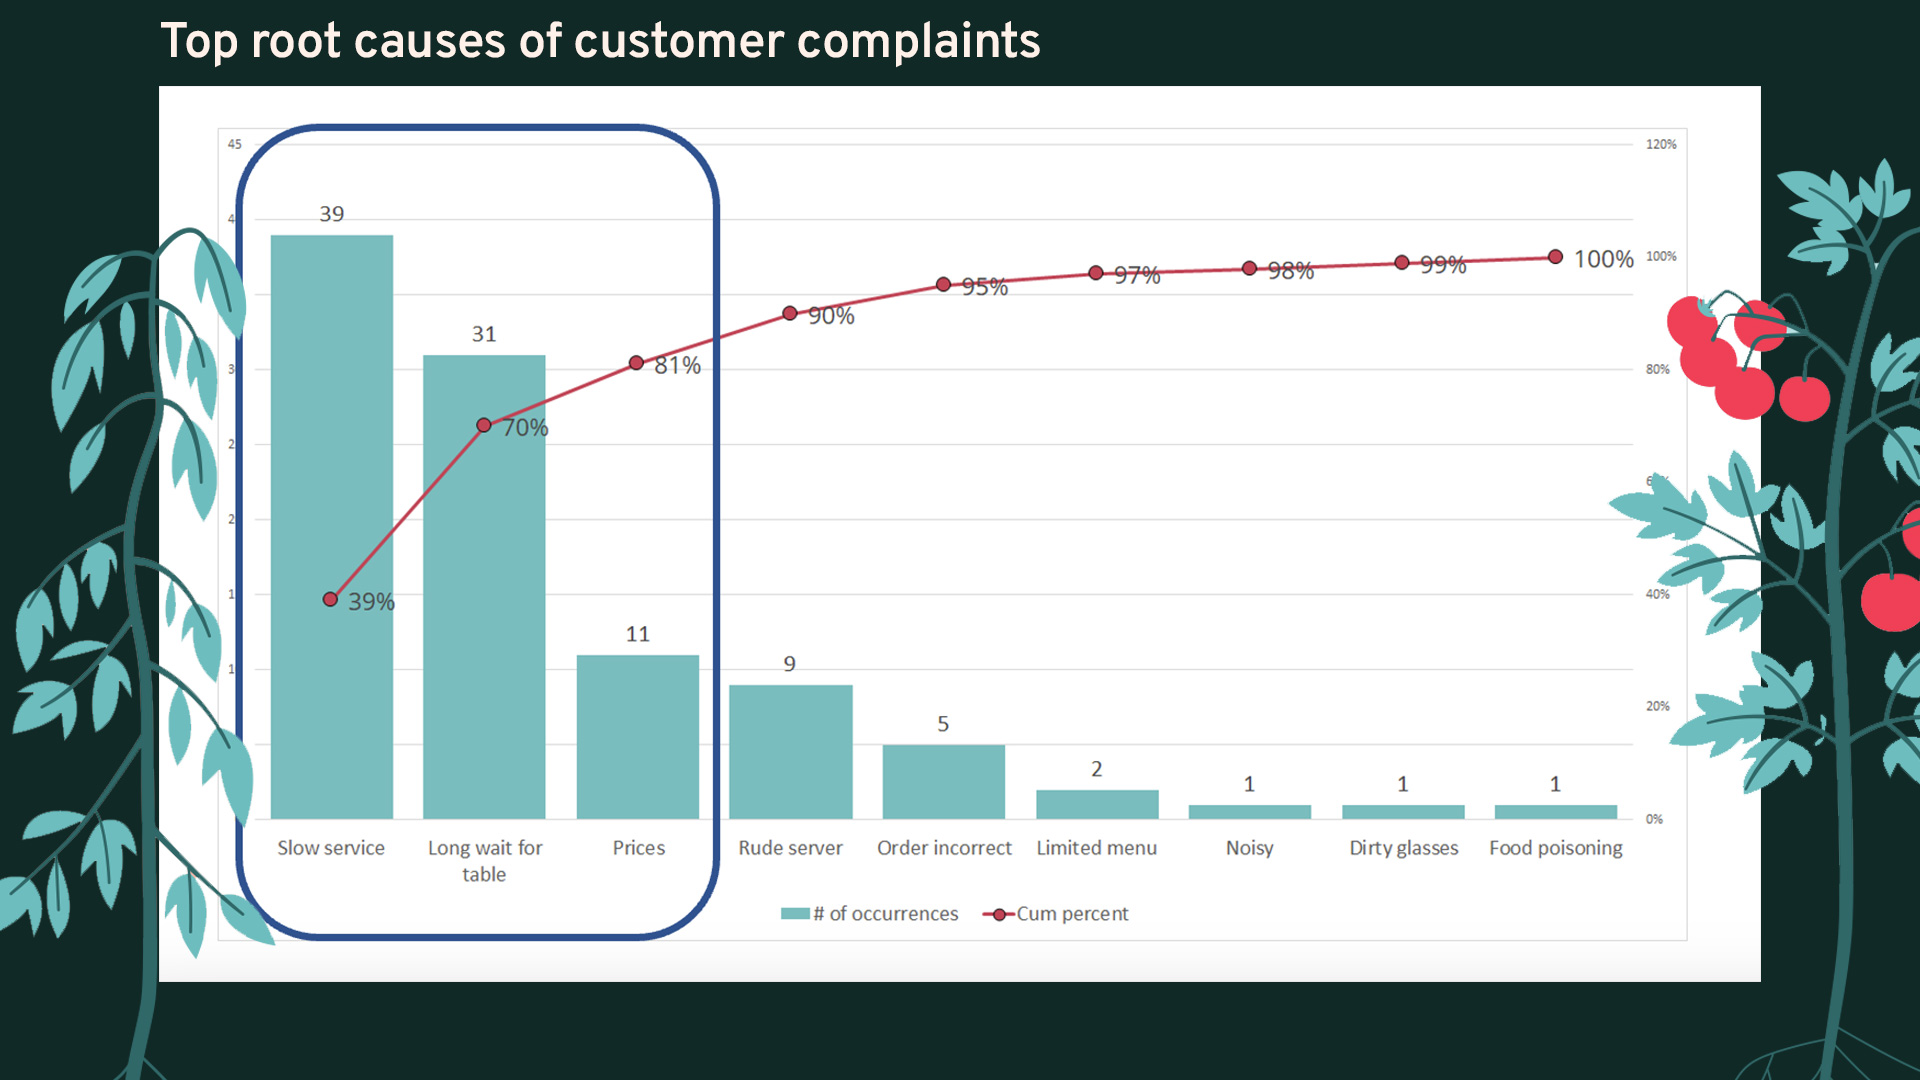
- Click on the “Pareto Chart” tab to analyze your data.
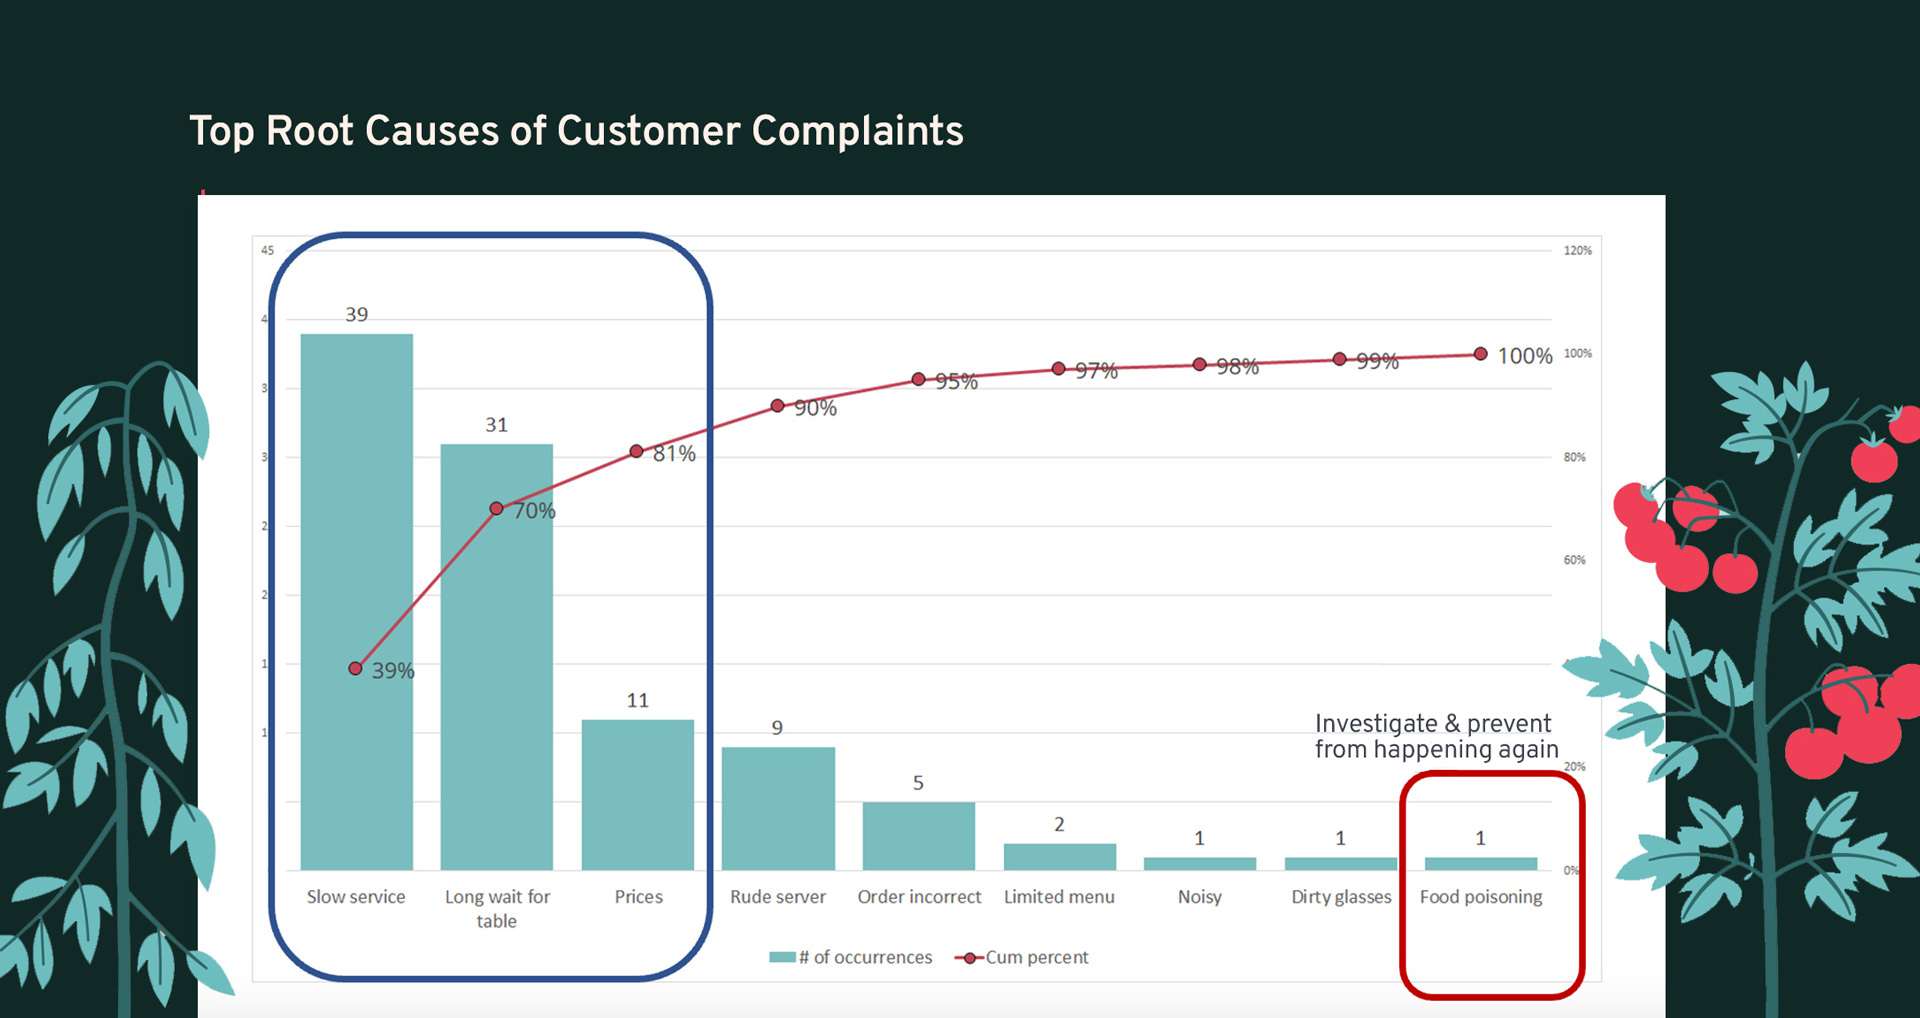
This Pareto Chart helps the improvement team see that slow service, long waits for tables and prices contribute to 80% of the customer complaints.
Step 4.
Caution!
While identifying the vital few root causes is important to drive improvement efforts, it’s important not to lose sight of critical issues to address, even if infrequent.
For example, our restaurant improvement team would want to learn more about the incidence of food poisoning to make sure that it never happens again, even if it only happened once.