

Leveraging Variation as a Tool for Improvement
An understanding of variation, when combined with subject matter expertise, can profoundly impact how we understand and therefore can improve our systems.
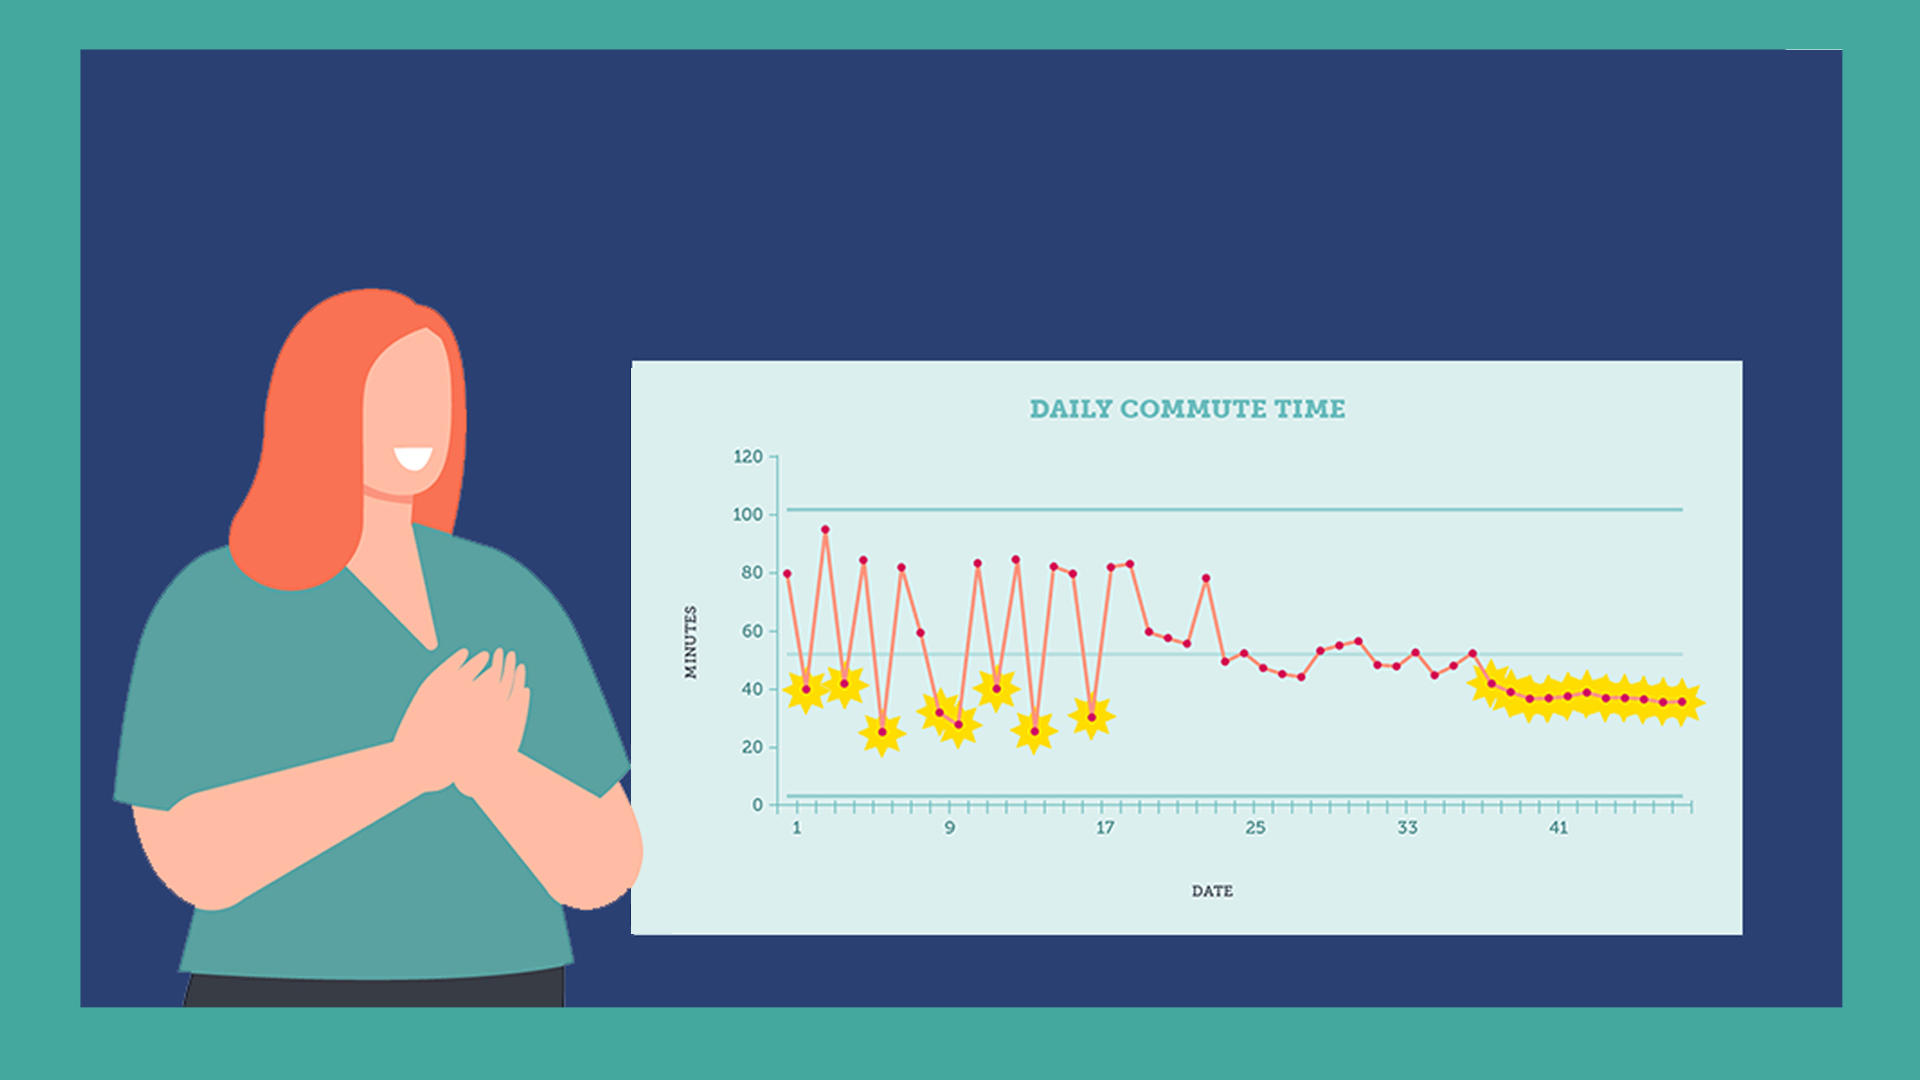
Variation—the fluctuation in the performance of a system—is intuitive. We experience variation in our daily lives, from how long it takes to get ready in the morning or the time it takes to commute to work to how much mail we receive in our mailbox or inbox.Variation can be either intended, trying something different in a planned or purposeful way, or unintended where variation is unplanned and typically produces waste, inefficiencies, or chaos. For example, variation in how long it takes to get ready in the morning may be intentional: we might shower or pack a lunch the night before. These are actions that we can do to speed up our morning routine. What we more often experience is unintended variation. This can look like not finding our car keys or having to dig through the laundry to find that one shirt or sock before leaving the house. These unintended fluctuations are big opportunities for improvement!
Unintended Fluctuations
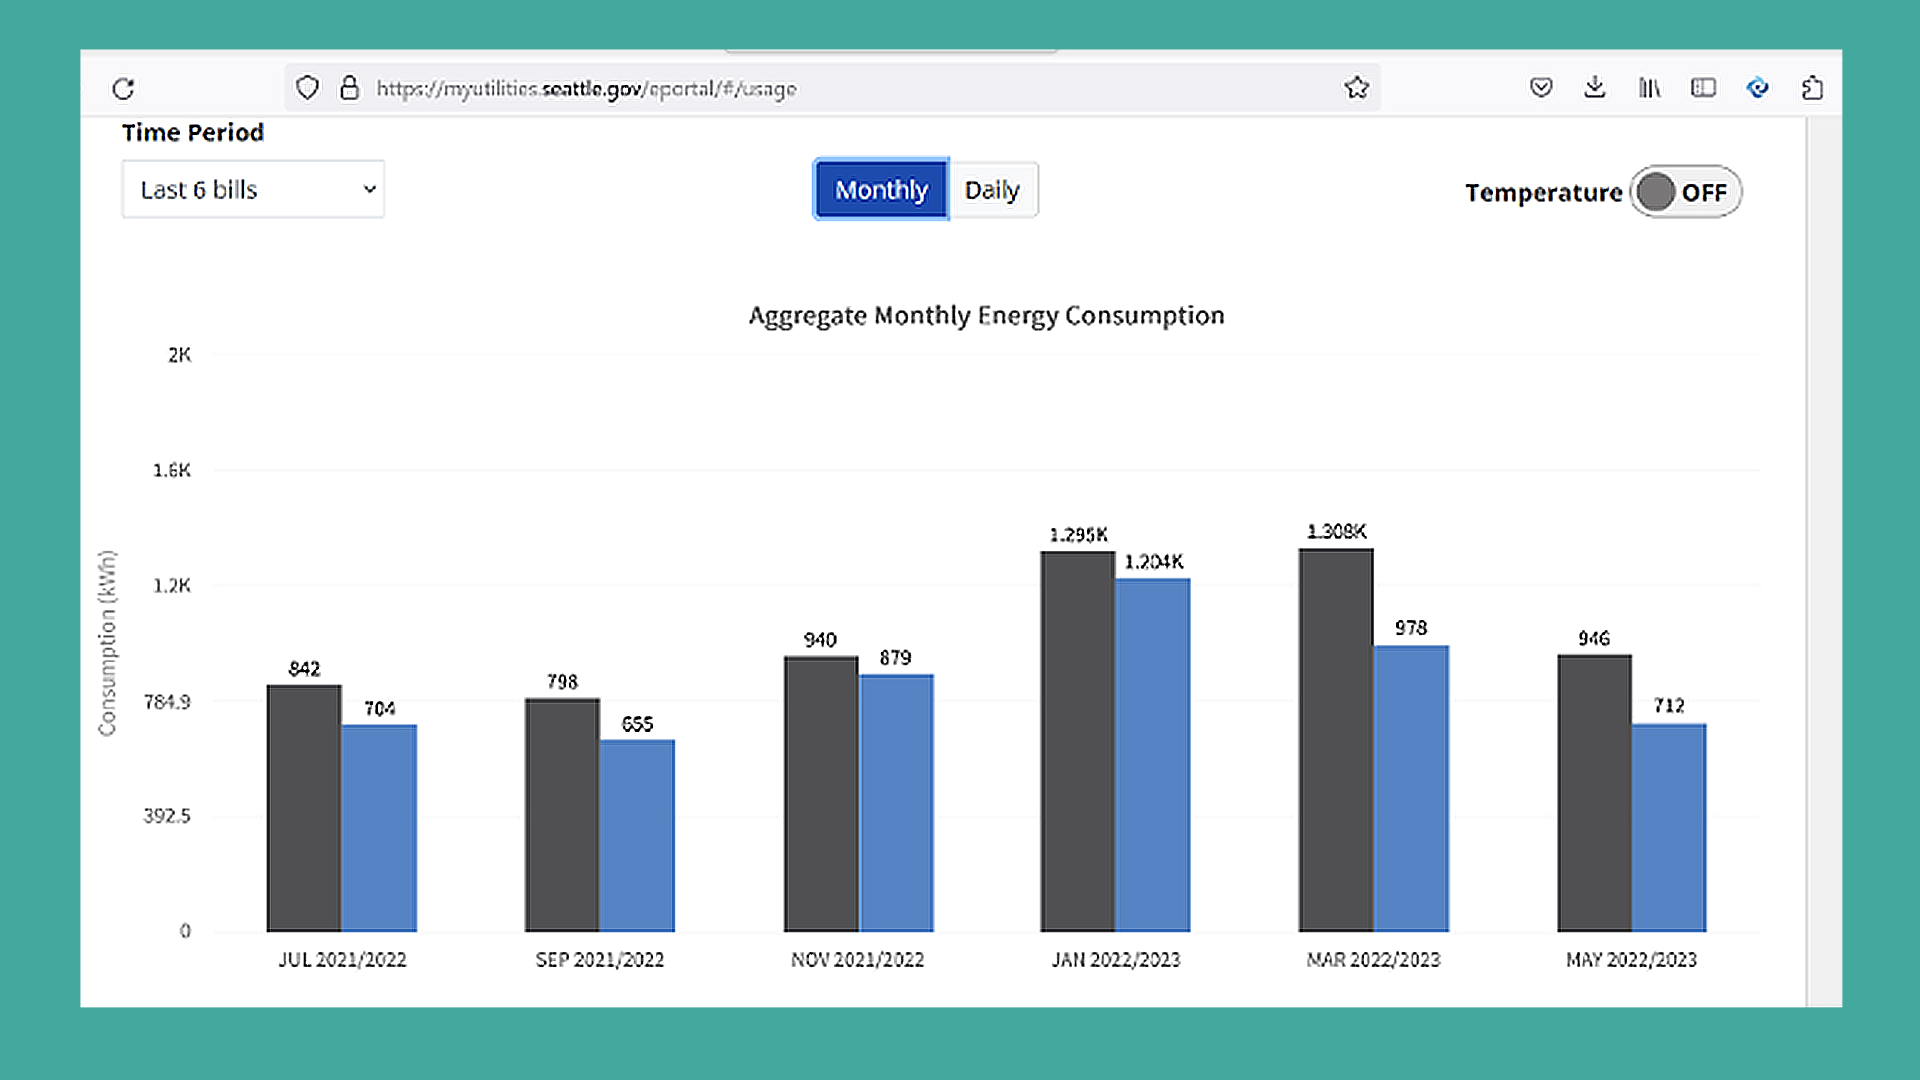
I recently received our household bill from Puget Sound Energy and was intrigued with how they display the data to help us track our energy usage over time. In the graph below, you can see the variation across six different months in different years. Though there is clear variation, there are also some noticeable consistencies. Our energy usage is consistently higher in the colder winter months of January and March, and lower in the warmer months of July and September.
Looking at these data over such long time periods, it’s easy to spot these seasonal trends. What surprised me was that while our overall energy usage went down in 2023, January 2022 and 2023 remain similar, and very high. Looking at data at this level of detail, I’m not able to glean very useful insights about why this may be.
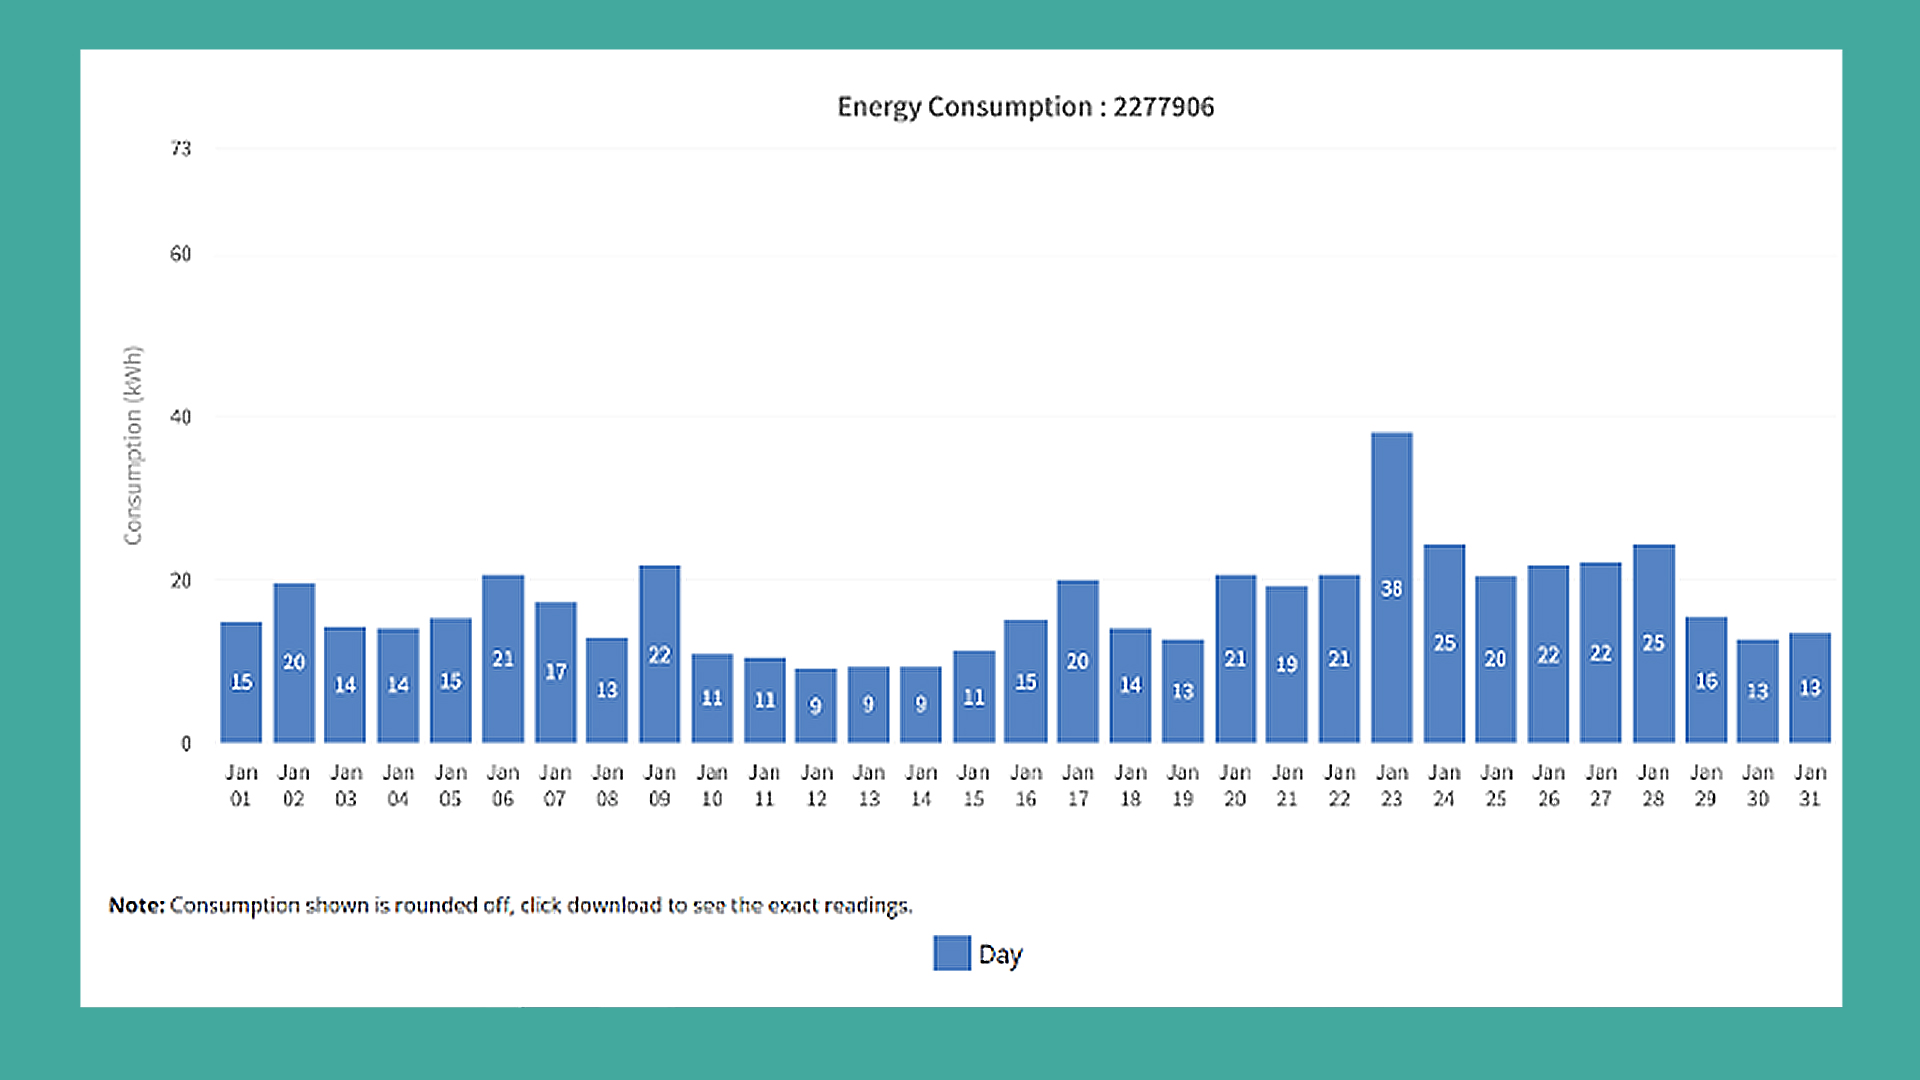
While the data in the first chart paint the big picture of variation over time, I gain more valuable insights and actionable information from the second chart below. When I look at the data on a daily basis, it becomes much more actionable. I can learn from the variation.
My household usually uses between 9 - 25 kilowatt hours per day. This is what we would call common cause variation—or regular random variation where data points vary within regular limits of what our system (in this case, my family) is capable of producing. Sources of common cause variation might be whether we were working from home or running a couple of loads of laundry that day. However, the 38 kilowatt hours on January 23rd does not likely fall within the boundaries of common cause variation (to be sure, we would have to establish control limits using data we have collected over time). Let’s say that this day’s usage does fall outside of common cause variation. This is called special cause variation. For example, that data point likely marked when we had record cold temperatures and an ice storm that required more energy to maintain a comfortable temperature in the home.
Check out our video “Learning from Variation” to learn more.
Now that you understand more about how variation works in everyday life, here are three big takeaways about why understanding variation is critical to improvement:
Takeaway #1:
Data is the voice of our processes and systems. We are most prepared to listen and learn from this voice when we plot data frequently over time on time series charts such as a run or Shewhart chart. I especially love run charts because all you need are paper and pencil and a process for recording data. Once created, you can hang it on the wall of a classroom or healthcare clinic for quick and accessible measurement. Busy improvers can annotate the different changes on run charts and look for “signals” of impact in their data.
These signals–what improvement science calls shifts and trends–indicate a 95% probability of non-random variation. In other words, it is 95% likely (or p value < 0.05) that something significant happened to change our results. This is very helpful to understand the impact of our improvement efforts! How amazing is it that you can do this type of statistical analysis without any computer software or advanced statistics preparation? This truly democratizes data so it is useful to everyone for learning and decision making.
In the spirit of democratizing learning, we also want to share free resources to further understand and apply run charts to learn from variation:
- Watch Shift’s video “Measurement for Learning” for a quick eight-minute overview about time series charts and signals.
- Check out this classic must-read article “The run chart: a simple analytical tool for learning from variation in healthcare processes” published by Rocco Perla, Lloyd Provost, and Sandy Murray in the British Medical Journal.
- Grab the improvement toolkit created by University Research Co for more guidance on creating time series charts. In Appendix 2, Lynne Miller Franco and I compiled terrific examples from public health efforts across the world based on the experiences of the ASSIST project funded by the United States Agency for International Development.
Takeaway #2:
Understanding variation sets the stage to create curiosity about why fluctuations exist between units, locations, providers, and more. This understanding creates the opportunity to design networks where organizations share data transparently, identify bright spots and opportunities for improvement, and use the variation to learn from each other. Network facilitators (like Shift!) - create norms and culture where it is safe to learn from data without judgment so that organizations can work together towards a bigger goal than any of them can accomplish alone.
I recently listened to an amazing podcast in which High Tech High’s Stacy Caillier, Ph.D., Director of the Center for Research on Equity and Innovation and the Deeper Learning Hub, interviewed Don Berwick about how to leverage variation to facilitate learning in a network. Among the many profound reflections that they both shared, this is my favorite:
“One of us is probably getting a better result than the other - it’s unlikely we are identical. If it's non-random, we can learn from real time data. Learning from variation in outcomes requires transparency and courage to discover someone does something better than I do. Think of improvement as the enterprise of making invisible variation visible for the purpose of learning.”
- Donald M. Berwick, MD, MPP, President Emeritus and Senior Fellow, Institute for Healthcare Improvement
Listen to High Tech High’s podcast: Don Berwick on Building Courageous Networks.
Takeaway #3:
Understanding variation uncovers the tacit knowledge that is key to variation across sites (e.g. hospitals, schools, etc). One key strategies to uncover and learn variation that Don and Stacy continued to discuss is live visits – organized site visits to places that are getting significantly better results. Live visits are a powerful tool for learning – for both the visitors and hosts. A few teams are invited to visit a site that is getting significantly better results in a key area.
Visits are typically organized in three main parts:
-
- The host site kicks off the visit with a brief presentation about what they have been testing and what they have learned.
- Hosts guide visitors in a walkthrough of their workplace where visitors observe the topic of interest in action.
- Visitors meet to share back their observations—both what they learned that they plan to try in their context as well as ideas and observations that might help the host.
This active hands-on learning is a fantastic way to uncover a depth of learning that is often not reached in a conference room where convenings/ learning sessions are often held.
These site visits uncover tacit knowledge about how an organization does their work that achieves different results. This level of knowledge is likely so deeply ingrained in how the organization is set up and does their work, that they might not even think to share how they get their results. When visitors walk through their workplace, they pick up important insights that are key clues as to why this organization gets different results.
I recall a live visit to a hospital that significantly reduced maternal deaths. Visitors gleaned so many insights that they took back to their hospitals – from where stretchers were located to prevent delays to sterilization checklists on equipment to reduce infection. Hosts not only felt proud of their work but were also able to receive learning from visitors about how they might organize their work with staffing shortages.
Live visits are especially practical if you are part of a regional improvement effort, for example in the same city, district or even state. Visits are more challenging if your improvement effort is at a national or international scale. Some ways to adapt this idea are to integrate live visits with learning sessions – for example by rotating the “host” city and integrating a site visit. High Tech High shared that they tried virtual live visits during the pandemic – and I am eager to try this!
We hope you learn from variation in your system!
Let us know how these resources support your improvement efforts or reach for help from our team at [email protected]!